Motivation
This tutorial serves as an introduction to a statistics education tool, called intRo. The goal of intRo is to foster a student interest in coding while learning basic statistics, or at a minimum, help students to learn a bit more about working with data.
As a web-based application, this tool is immediately more familiar to students than a desktop application. The need for dealing with software licenses, installation configuration, and supported platforms has been eliminated. This allows students to spend more time working with the data and learning statistics than having to struggle to get the software running.
Why intRo?
Unlike JMP, intRo requires no software licenses or manual installation. intRo's 'functionality is focused on introductory statistics students, and nothing more (no extraneous functionality that must be navigated around to get to the content they need). intRo provides students an opportunity to see the underlying functionality of the buttons, text boxes, and other UI elements, in an attempt to foster an interest in coding. However, the functionality of intRo is point-and-click so those uninterested in coding will not be intimidated by the features of intRo.
Deducer provides a GUI for R which, like intRo, allows the viewing of underlying code. However, Deducer requires a manual installation dependent on Java. While intRo presents a minimal set of options for statistical analysis, Deducer provides many of the advanced features of R that may not be applicable for an introductory statistics student.
Interface
We designed intRo to have an intuitive user interface. We used large, easy to click icons in the page header. Each module maintains a consistent layout, helping the user to become familiar with the location of the options, the results, and the code. In the screenshot below, we highlight the five elements that comprise the intRo interface.
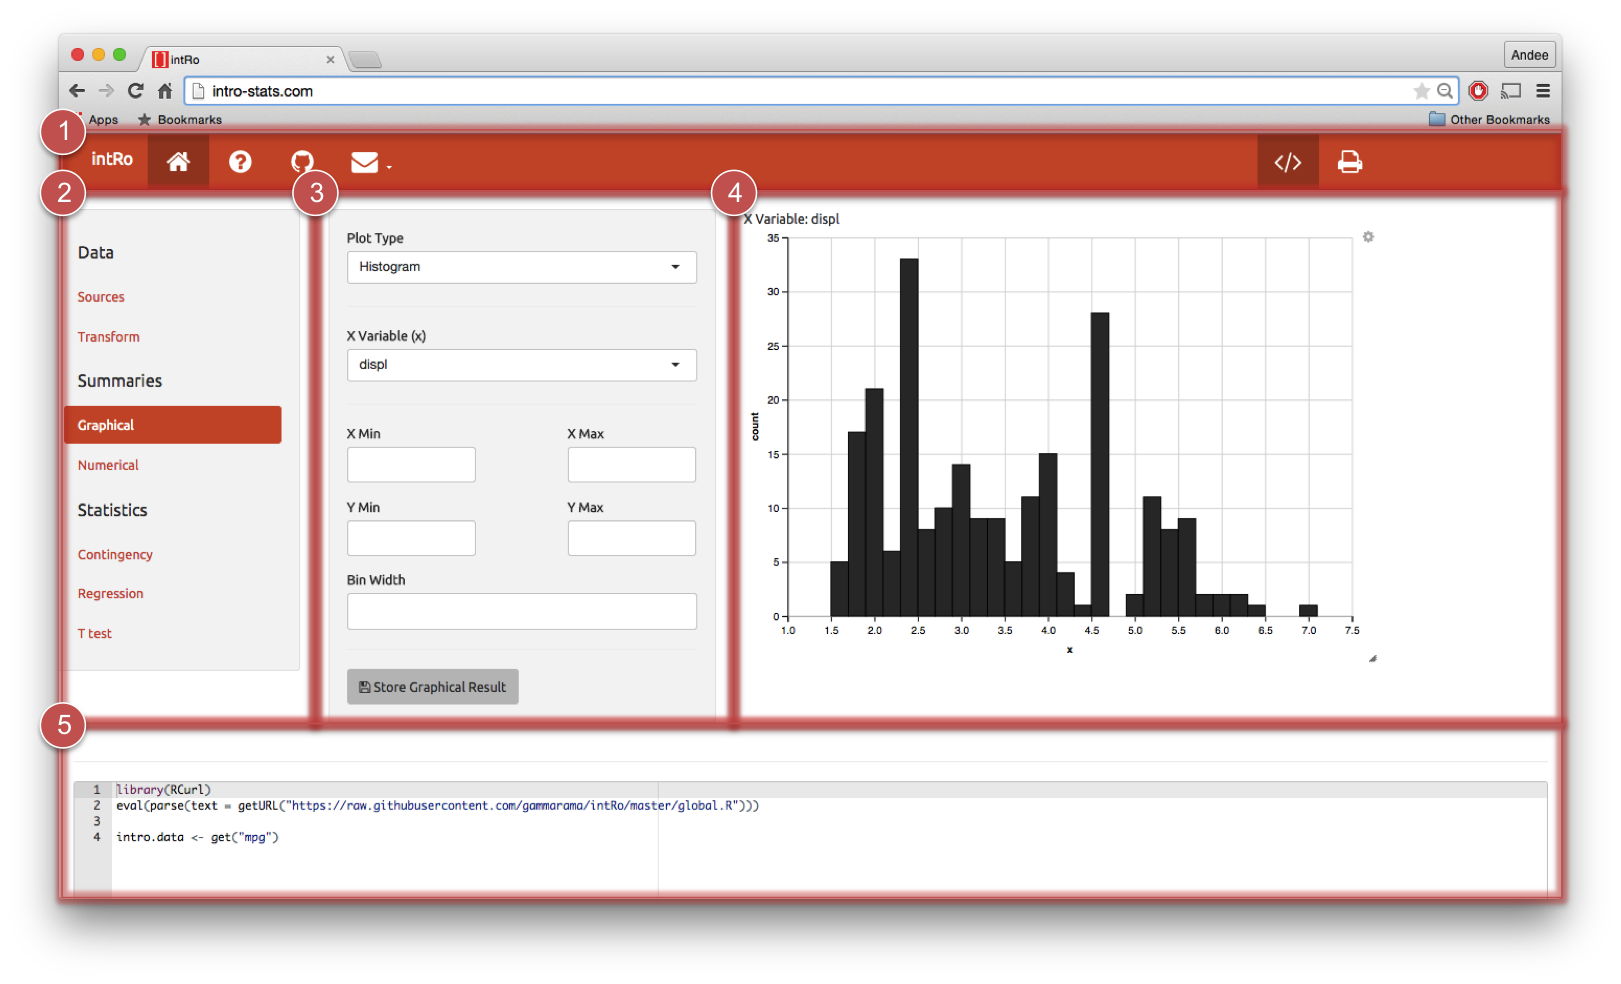
- Top Navigation - The top navigation bar includes two sets of buttons. The left-aligned buttons are informational buttons. The first is a link to intRo. The second is a link to this documentation page. The third is a link to the GitHub repository where the code for
intRo is housed. The final button is a link to our websites, which contain contact information if there are any questions or comments. The right-aligned buttons are intRo utilities. The first is a button to toggle the visibility of the code panel (5). The last is a button to print the active module results, and the associated code (if visible).
- Side Navigation - The side navigation panel includes the modules which are detailed later in the tutorial.
- Options Panel - The options panel includes module-specific options which the user can use to customize their results.
- Results Panel - The results pane displays the result of the selected module and options.
- Code Panel - The code panel displays the R code used to generate the results from the student's
intRo session. The code panel is shown by default to facilitate an interest in coding, but can be hidden by clicking the code toggle button in the Top Navigation bar.
There are multiple modules within intRo, which perform specific data analysis tasks that employ an easy to use point-and-click interface. Continue with the tutorial to read more about each one.
Sources
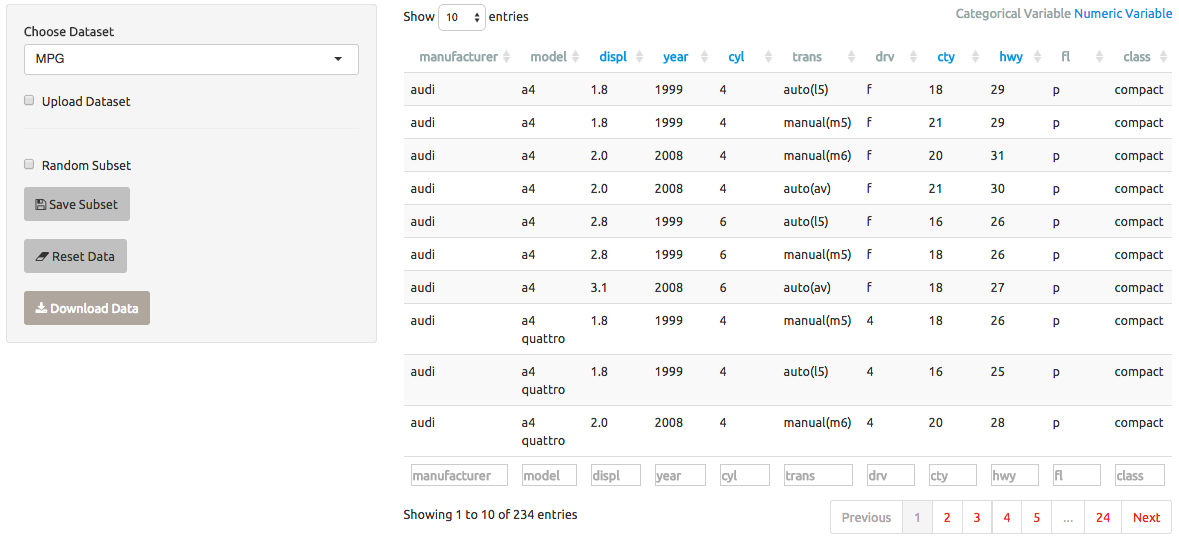
The sources module allows the user to select or upload a dataset. Several datasets are pre-included, which can be selected via a drop-down menu. The user can check a box to upload a dataset, and then select the text file from their computers (currently only CSV files are supported). The user can also select random or pre-specified subsets of their data, reset their data to its status before any subsets or transformations were performed, and download their data to their computer.
Upon selection or successful upload of a dataset, a table view of the data will be visible on the right. There are several features available. First, the user can select the number of records to display per page. Second, the user can click any column of the data in order to sort by that column. Third, search fields are available each individual column, and any subset chosen here can be saved with the Save Subset button. Finally, the user can page between rows of the dataset with the buttons along the bottom.
The dataset selected in the data module will be made available to all other modules of intRo.
Transform
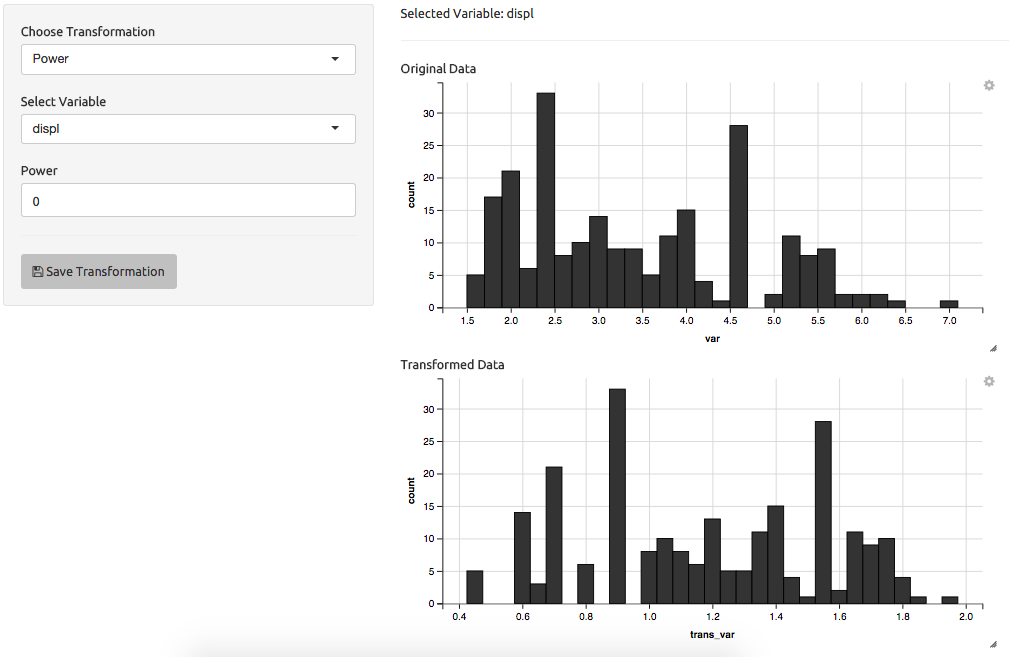
The transform module allows the user to perform three different transformations on their data. For numeric variables, they can perform a power transformation, or convert the column to a categorical variable. For categorical variables, they can convert the column to a numeric variable.
For power transformations, histograms of the original and the transformed data will be displayed on the right. When the user is satsified with the choice of transformation, the Save Transformation button can be clicked, which will store the resulting transformation into the dataset for use throughout intRo.
Graphical
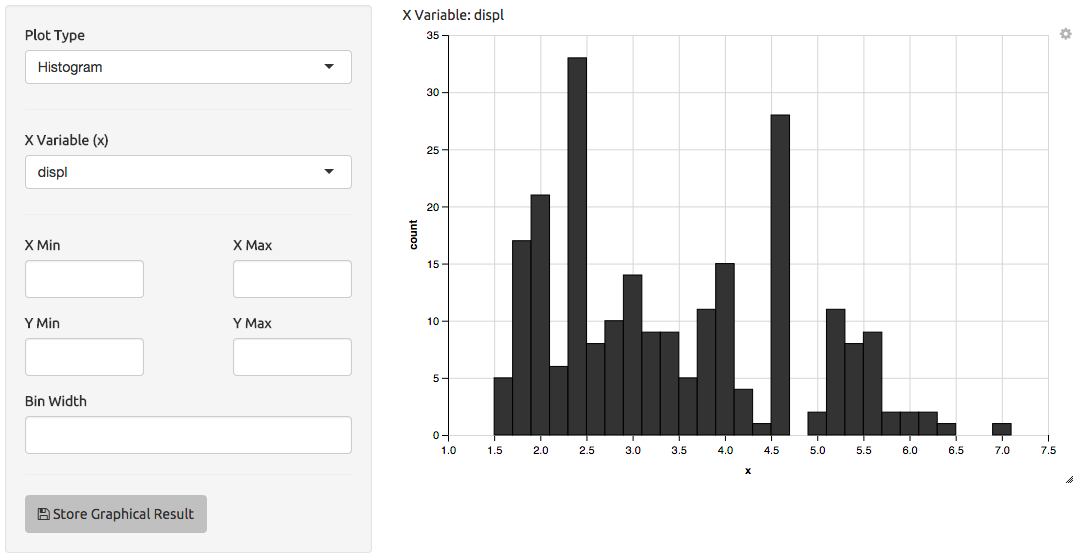
The graphical module provides several common graphical displays of variables in the dataset. First, the user selects a particular plot. This choice determines the variable choices from the dataset presented to the user. The plot visible on the right will automatically update when these values are selected. The graphical displays available are:
- Histogram
- Boxplot
- Scatterplot
- Line Chart
- Boxplot
- Bar Chart
- Pareto Chart
If there are options corresponding to the plot type selected, they will be displayed beneath the plot in the results panel. For example, users can select the bin width corresponding to the width of the bar for histograms.
Numerical
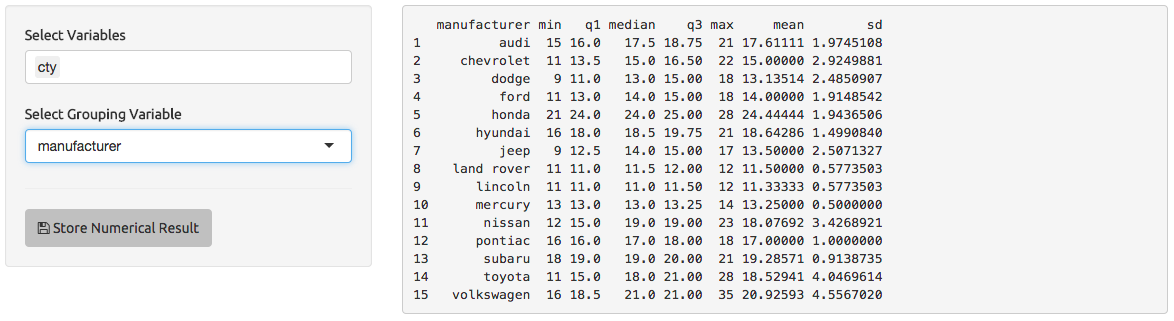
The numerical module is another method of computing summaries of the data. The user can select one or more different variables, and will be presented with a table of some summary statistics. The user can also select a grouping variable, in which case the summary statistics will be computed on each subset corresponding to different values of this grouping variable.
The summary statistics displayed vary depending on the type of the variables. For instance, for a numeric variable, a five number summary consisting of the minimum, maximum, first quartile, third quartile, and median will be displayed, along with the mean and standard deviation. Character or factor variables will display counts of each unique value of that particular variable.
Contingency
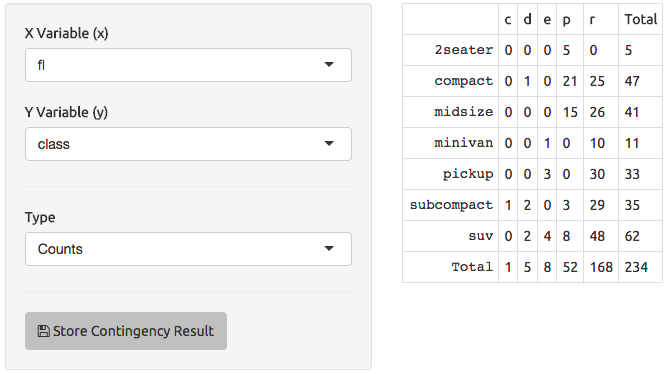
The contingency module allows the user to construct contingency tables of two categorical variables from their dataset. The user is shown only categorical variables, and selects the two of interest. They can also specify whether to display counts, row proportions (in which each row sums to 1), column proportions (in which each column sums to 1) or total proportions (in which the table sums to 1). If proportions are selected, the user is also given an option to select the number of significant digits to display in the table.
Simple Linear Regression
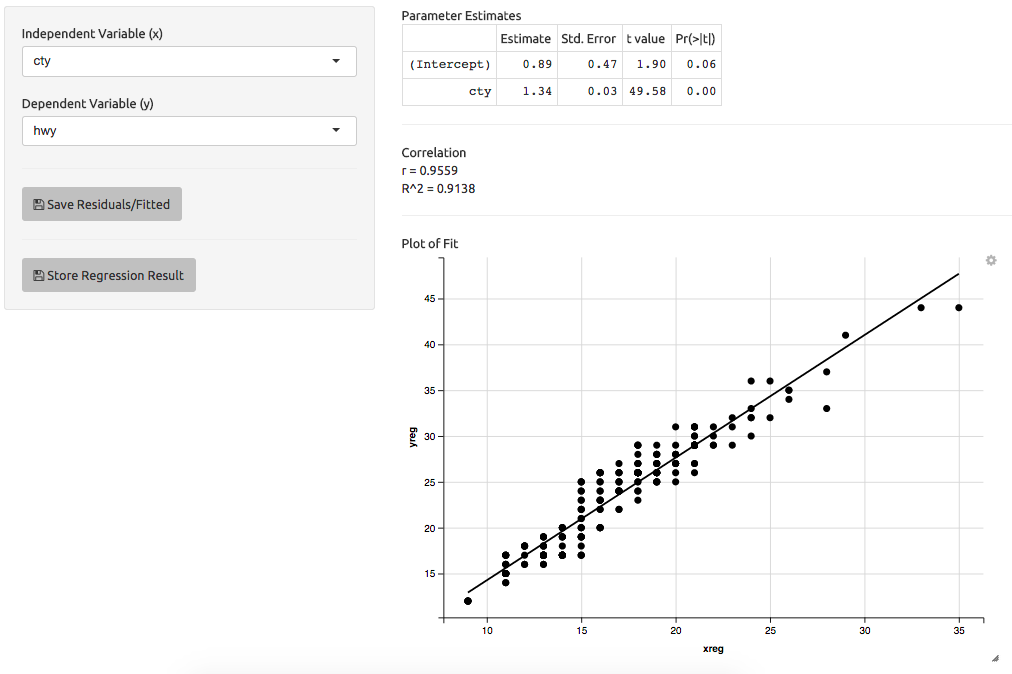
The regression module allows the user to compute a simple linear regression of a dependent variable (y) on an independent variable (x). The module will automatically filter any variables that are non-numeric so that the user may only select variables that are suitable for a simple linear regression.
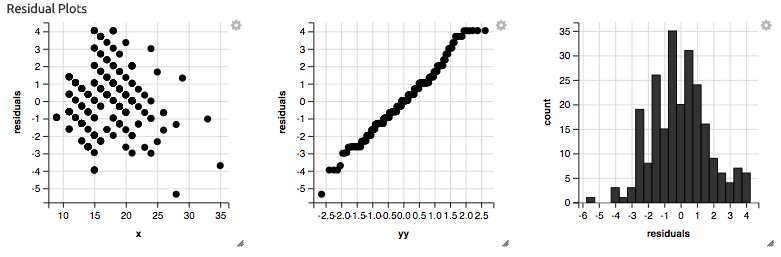
Results of the regression will be displayed on the right. A table of parameter estimates, along with standard errors, t statistics, and p-values will be displayed. Beneath it, the r and R^2 values for the regression are displayed, as well as a scatterplot of the data along with a line of best fit. Finally, residual diagnostic plots, including a plot of residuals against the independent variable (x), a normal quantile plot of the residuals, and a histogram of the residuals, will be printed at the bottom.
The users are also given the ability to save the residuals and fitted values from the regression back into the data. By clicking this bottom, two new columns will be created in the data, allowing the user to further explore these results.
T test
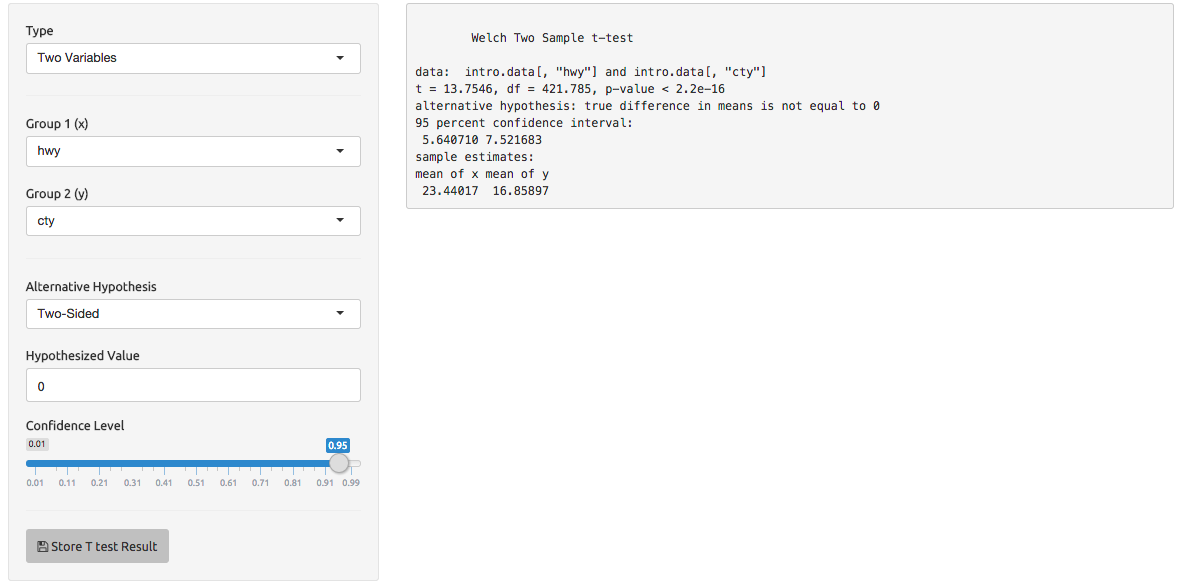
The T test module allows the user to perform a Student's T test to assess, in the one variable case, whether the mean of a variable is different from a hypothesized value, or in the two variable case, whether the difference of two variables are different from a hypothesized value. The user can select configuration options, including the direction of the test and the confidence level of the test. The results, including the t statistic, degrees of freedom, p-value, and a confidence interval, will be displayed in a text box in the results panel.
Code
The code button toggles the code panel. The code panel, visible at the bottom of the intRo interface, displays the code stored during the user's session. The code panel includes line numbers, as well as R code syntax highlighting. Note that each module includes a Store button which will allow the users to store the code generating the output in the Results Panel.
Printing
The print button will print results from the active module. If the code panel is visible, the code will be included the printed document.