August 12, 2015
Introduction
What is intRo?
- A simple web-based application for performing basic data analysis and statistical routines
- Built using
RandShiny - Extensible modular structure
- Designed for a first statistics class student
- Assists in the learning of statistics rather than acting as a stand-alone deliverer of statistics education
Do we really need another statistical software package?
Short answer: yes
Ris great, but requires students to have some knowledge/interest in programmingJMPis powerful, but lots of functionality for intro stats- Software licensing issues
- New tools recently released to spark an interest in
RSwirland DataCamp teachRprogramming- Project MOSAIC facilitates learning, but assumes knowledge of
R
- Want students to focus on data analysis rather than fight with software
Easy
- Focused on aspects of the user interface (UI) and output that make it easy to pick up without training
- Minimal necessary functionality for an introductory statistics course
- Organized around specific tasks a student may perform in the process of a data analysis
Exciting
- Fun, easy to use (available on the web)
- Interactive plots using
ggvis
Ulterior motive: get students excited about programming
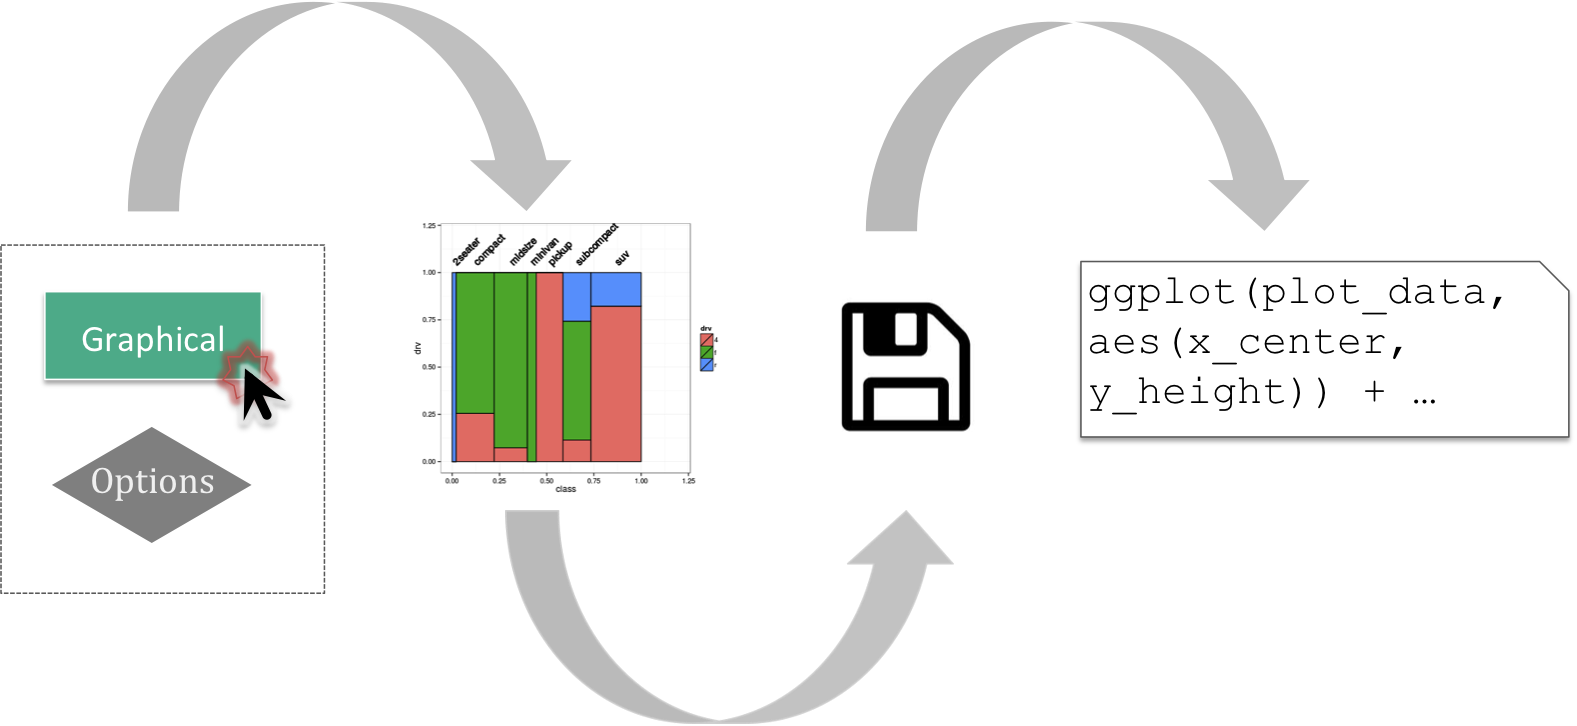
- By navigating about the user interface of
intRo, students are creating a fully-executableRscript that they can download and run locally - Viewing their script change real-time within the application
Extensible
- User interaction with
intRois split into bitesize chunks that we call modules - Each module is a self contained set of
Rcode that is dynamically added to the application at run time intRocan be easily extended by the addition of modules within the frame-work underlying the application- Allows instructors/collaborators to tailor
intRoto the needs of a particular course
Classroom
intRo in the wild
intRowas used last semester at Iowa State University in STAT 201- Homework assignments and labs used
intRoto emphasize class concepts
- Homework assignments and labs used
intRois a supplement, not the focus of the class
Homework 1
- Data: OECD PISA Results in Focus report to assess the workforce readiness of 15-year old students
- Goal: Explore graphically and numerically how the students perceive academics and math
intRoTasks:- Make a barchart of the variable Enjoy.Maths.
- Make a summary of the Enjoy.Maths variable. What proportion of these students agree or strongly agree with the statement "I enjoy mathematics"?
- Obtain a contingency table and mosaic plot of the relationship between Country and Enjoy.Maths. Print contingency tables with the Count and Column Proportion values.
Live Demo
Feel free to try intRo yourself at
Design decisions
Consistent UI
Elements of intRo: 1) top navigation, 2) side navigation, 3) options panel, 4) results panel, and 5) code panel.

Modularity

Future work
What's next?
- Module creation package
- Server load
- Use in other classes
Module creation package
Modularity is a key feature of intRo, but module creation is currently:
- Undocumented
- Entirely manual
- Unnecessarily lengthy
Idea: R package (with associated Shiny app?) to automate creation of intRo modules
Server load
Limited testing has been done to assess how intRo handles heavy user load
- Dozens of students accessing app at once
- Simultaneous larger computations like printing results
More server resources may need to be devoted to handle this, particularly if intRo is more widely adopted
More classes
- We would like work with instructors to get
intRointo more classes - Module creation package will allow it to suit more curricula
- We welcome collaborators interested in extending
intRoto submit pull requests on GitHub (http://www.github.com/gammarama/intRo)- Additional modules
- Improvements and bug fixes
Any questions?
Thank you!
Contact:
ajkaplan@iastate.edu
erichare@iastate.edu